On the April 6, 2018 FiveThirtyEight Riddler Express
The Riddler is the excellent math and logic puzzle weekly by Oliver Roeder. Puzzles are posted every friday, together with the solutions to the previous week’s puzzles. I occasionally submit proposed solutions, using R whenever possible. Yesterday Ollie was kind enough to give me a shout out for the ggplot chart that I provided together with my solution to the previous week’s Riddler Express. This is a brief post going over my submission code, please refer to Ollie’s post for the puzzle description. The puzzle can be solved with just 16 lines of R code.
R Code to Evaluate All 21st Century Dates
library(zoo); library(tidyverse)

mydate <- as.Date('2001-01-01')
i <- 1; results <- matrix(nrow=212,ncol=3)
repeat {
mymonth <- as.numeric(format(mydate,'%m'))
myday <- as.numeric(format(mydate,'%d'))
myyear <- as.numeric(format(mydate,'%y'))

if (mymonth*myday == myyear) {results[i,1] <- as.Date(mydate); i<-i+1}

mydate <- mydate+1
if (mydate==as.Date('2100-01-01')) break
}
# Get year of each attack
results[,2] <- as.numeric(format(as.Date(results[,1]),'%Y'))

# Get gaps between dates
results[2:212,3] <- diff(results[,1])
How Many Attacks Will Happen?
nrow(results): 212
What Year Will Have the Most Vandalism?
names(sort(table(results[2:212,2]), decreasing = T)[1]): 2024
How Many? sort(table(results[2:212,2]), decreasing = T)[1]: 7
What Year Will the Least Vandalism? Multiple Years Have No Attacks, See Chart Below
What is the Longest Gap Between Attacks?
max(results[2:212,3]): 1097 days
What is the Shortest Gap Between Attacks?
min(results[2:212,3]): 16 days
Plot Results
res <- as.data.frame(results)
colnames(res) <- c('date','Year','Count')
res <- res %>% group_by(Year) %>% summarize(Count=n())
bc <- data.frame(Year=2001:2099)
bc <- left_join(bc,res)
bc[is.na(bc$Count),'Count']<-0
bc$Count<-as.factor(bc$Count)

ggplot(bc,aes(x=Year,y=Count)) +geom_col(aes(fill=Count)) +theme_classic() +scale_fill_brewer(palette = 'Set1') +
  ggtitle('Anarchist Attacks by Year',subtitle = '212 Anarchist Attacks in Century')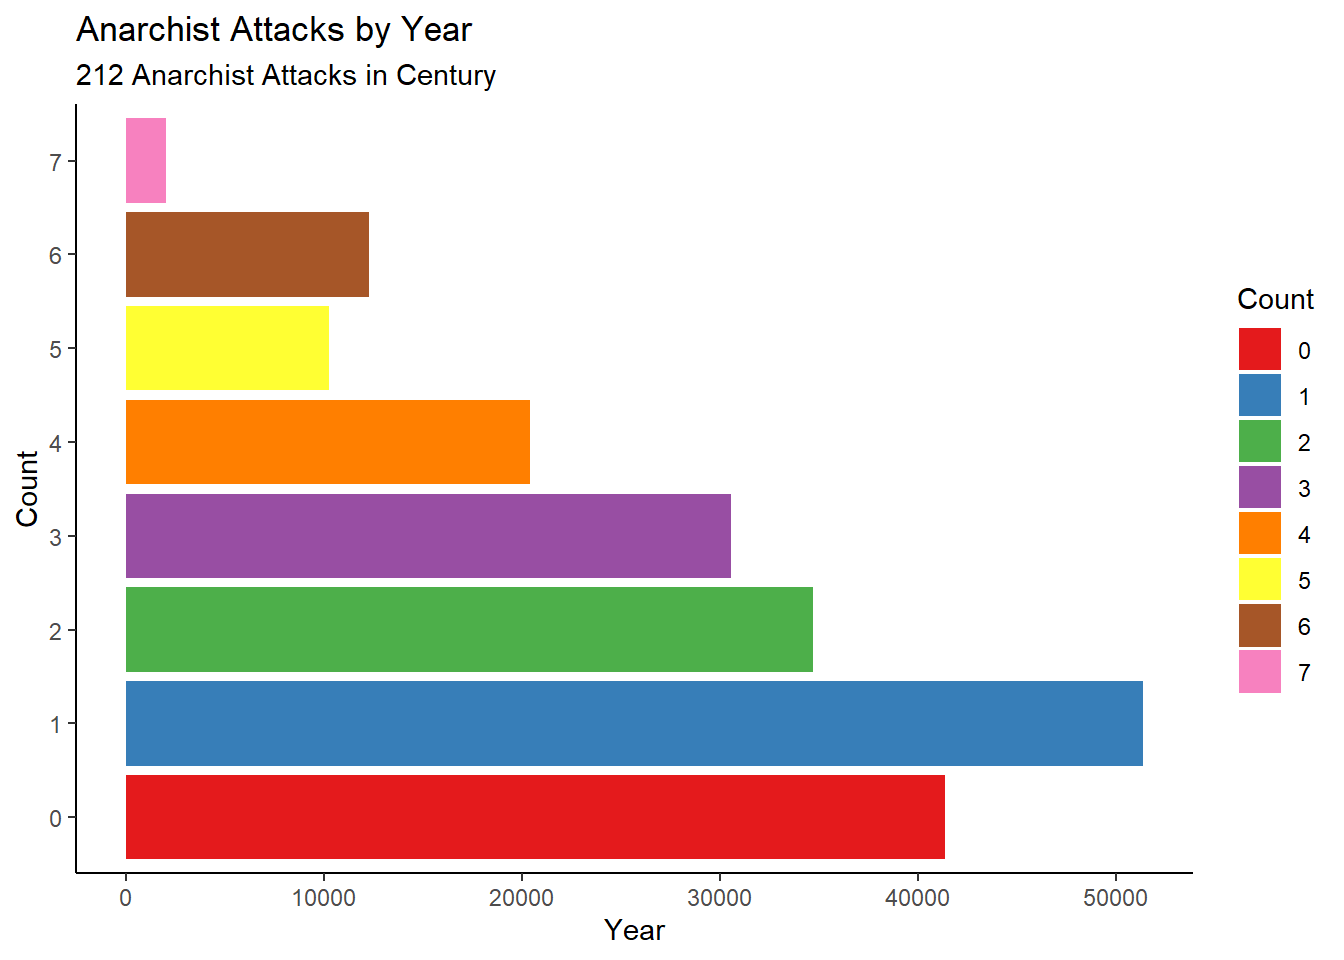
Twitter user @Cardlinger commented on the fact that the y axis seems to start at a negative value. This allows for “zeros” on the chart to be clearly distinguished. Otherwise, with 99 bars, the small gaps between gaps caused by zeros would be difficult to identify.
I wanted to clearly show the zero-attack years -- that was one of the questions in the wording of the puzzle. starting the axis at the normal value wouldn't allow to clearly show that, since there are 99 bars.
— Hernando Cortina (@cortinah) April 13, 2018
Fair dos, presentation over axis hygiene. 99 bars but a 0 ain't one!
— Peter Harris (@Cardlinger) April 13, 2018