Should You Take the Three Deck Monte Bet?
This week’s FiveThirtyEight Riddler Classic is about whether you should play “Three Deck Monte” on a street corner. You pick one of three decks offered with all cards visible, and your opponent then picks one of the two others. After shuffling each deck you compete in a game similar to War. You each turn over cards one at a time, the one with a higher card wins that turn, and the first to win five turns wins the game. The decks look like this:
- Red deck: four aces, four 9s, four 7s
- Blue deck: four kings, four jacks, four 6s
- Black deck: four queens, four 10s, four 8s
Should you play the game?
Simulating the Game
My approach to finding the solution is to simulate each of the six possible match ups, knowing that your opponent will pick the deck that offers the highest probability of winning the game. We run 100,000 replications of each of the six match ups and plot the results below. The heatmap shows the mean probability of winning. We also calculate the standard deviation, so we can compute the error around that mean.
library(ggplot2)
game <- function(mydeck, hisdeck) {
decks <- list(
  Red=c(14, 14, 14, 14, 9, 9, 9, 9, 7, 7, 7, 7),
  Blue=c(13, 13, 13, 13, 11, 11, 11, 11, 6, 6, 6, 6),
  Black=c(12, 12, 12, 12, 10, 10, 10, 10, 8, 8, 8, 8) )

my_hand  <- sample(decks[[mydeck]], 12)
his_hand <- sample(decks[[hisdeck]], 12)

min(which(cumsum(my_hand > his_hand)==5)) < min(which(cumsum(my_hand < his_hand)==5))
}

meansd <- function(x) return(c(mean(x), sd(x)))

sim_games <- function(mydeck, hisdeck, count) {
 c(mydeck, hisdeck, meansd(replicate(count, game(mydeck, hisdeck))))
}

sim_all <- function(count) {
results <- data.frame( rbind(
    sim_games('Red','Blue', count),
    sim_games('Red','Black', count),
    sim_games('Blue','Red', count),
    sim_games('Blue','Black', count),
    sim_games('Black','Blue', count),
    sim_games('Black','Red', count) ))
colnames(results) <- c('mydeck','hisdeck','Wins','sd')
results$Wins <- as.numeric(as.character(results$Wins))
results }

results <- sim_all(100000)

ggplot(results, aes(x=hisdeck,y=mydeck,fill=Wins)) + geom_tile() +theme_bw(base_size = 14) +coord_fixed() + theme(panel.grid.major = element_blank()) +labs(title='FiveThirtyEight Riddler Classic',subtitle='Should You Take the Three Deck Monte Bet?',caption="by: @cortinah, 2/2/2019",
  x='His Deck', y='My Deck') +scale_fill_continuous('My\nwin\nprob')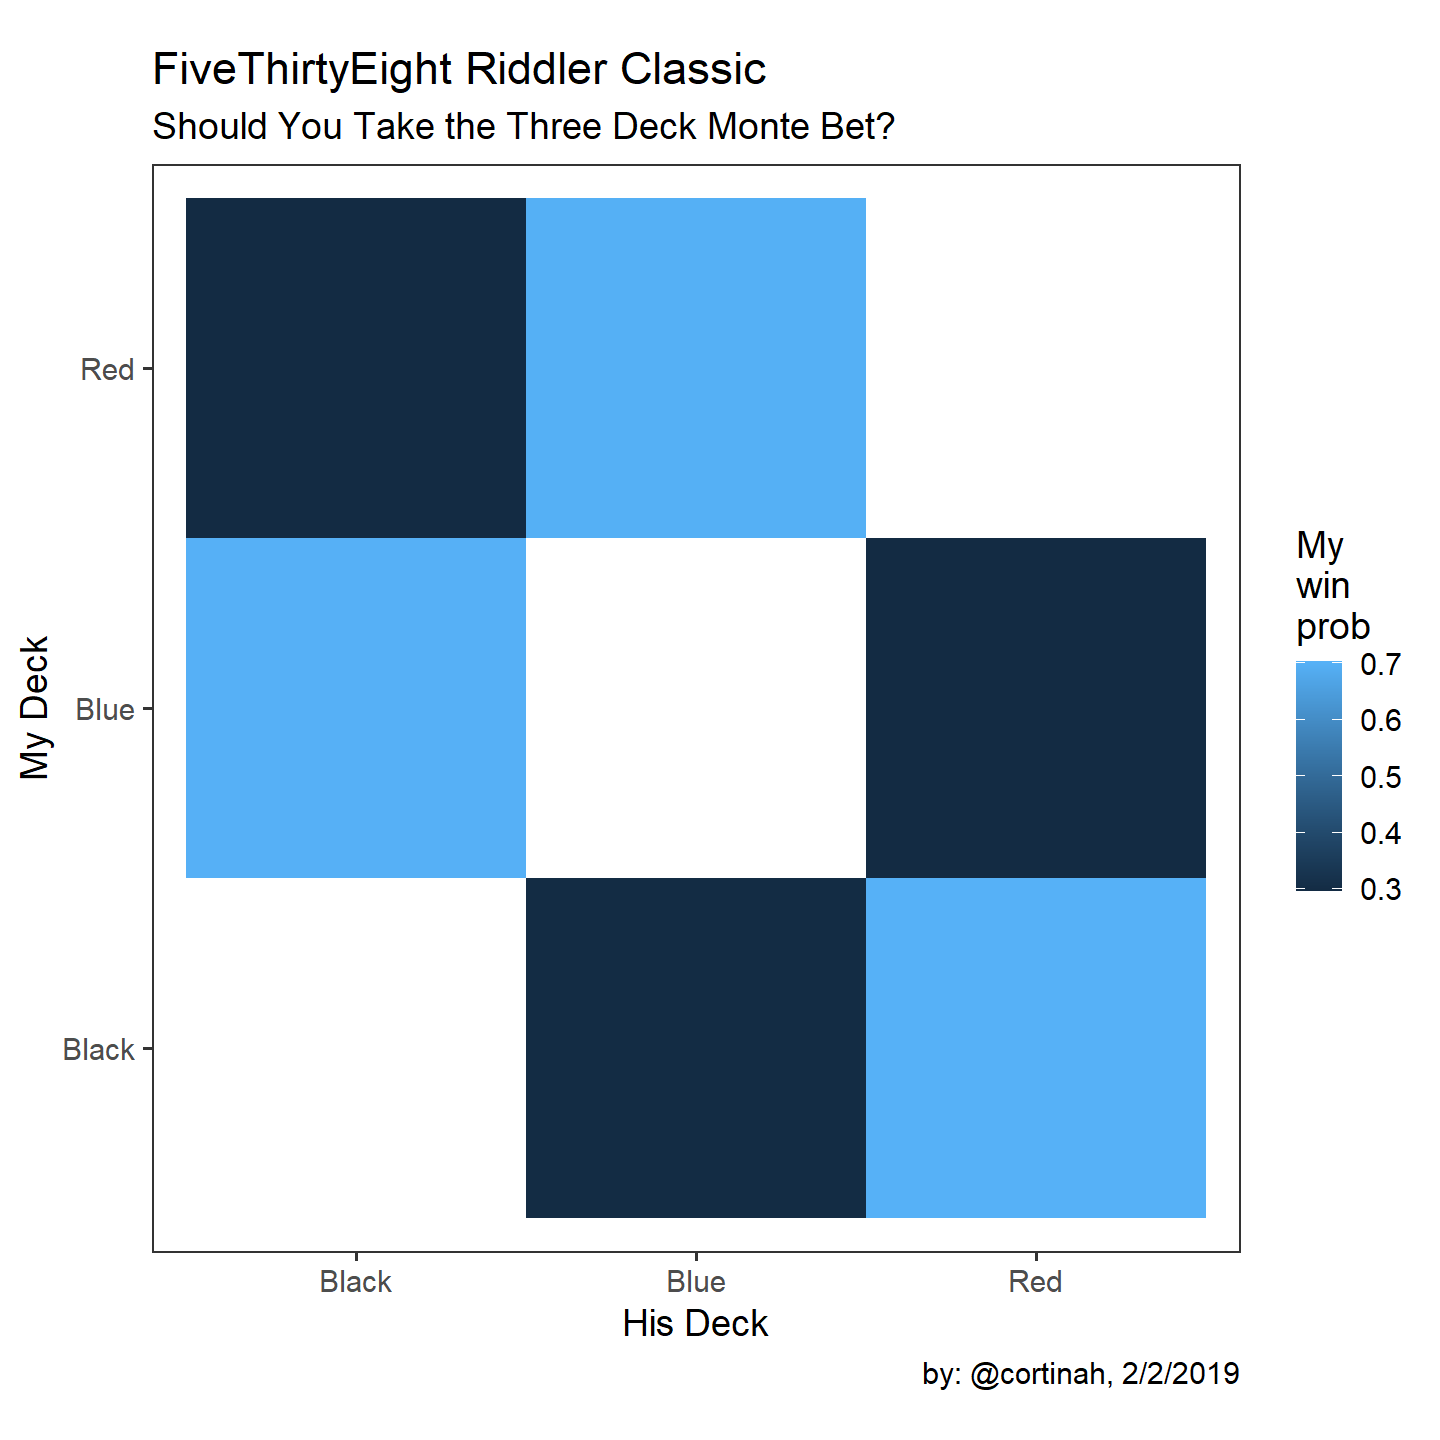
Don’t Play This Game!
As the heatmap shows, no matter what deck you chose, your opponent can choose a deck that gives him approximately 70% chance of winning. For example, if you choose the red deck, he can then choose the blue deck, giving him 70% odds of winning, and so on. As a check on the reliability of the results we use the
\[ \sigma_{m}=\frac{\sigma}{\sqrt{N}} \]
formula to compute the standard error of those means. For example if your opponent plays optimally you probability of winning is only 29.7% +/- 0.1%. So don’t play this game…| My deck | His Deck | My Win % | Std Error |
|---|---|---|---|
| Red | Blue | 70.0 | 0.1 |
| Red | Black | 29.7 | 0.1 |
| Blue | Red | 29.8 | 0.1 |
| Blue | Black | 70.2 | 0.1 |
| Black | Blue | 30.0 | 0.1 |
| Black | Red | 70.4 | 0.1 |