Another Riddler Classic Simulation + Animation
This week’s FiveThirtyEight Riddler Classic presented another opportunity to simulate repeated sampling and visualize the results. In this instance we needed to find the average number of unique 10-card samples needed to form a set of 100 unique cards.
The first resulting chart below shows the distribution of the results of each sim using a density plot. I tried to add a bit of statistical rigor by calculating the standard error of the mean number of samples. This has the benefit of helping decide how many times the simulation should be run. In this case I used the well-known standard error of the mean formula:
\[ S.E.=\frac{\sigma(x)}{\sqrt{n}} \]
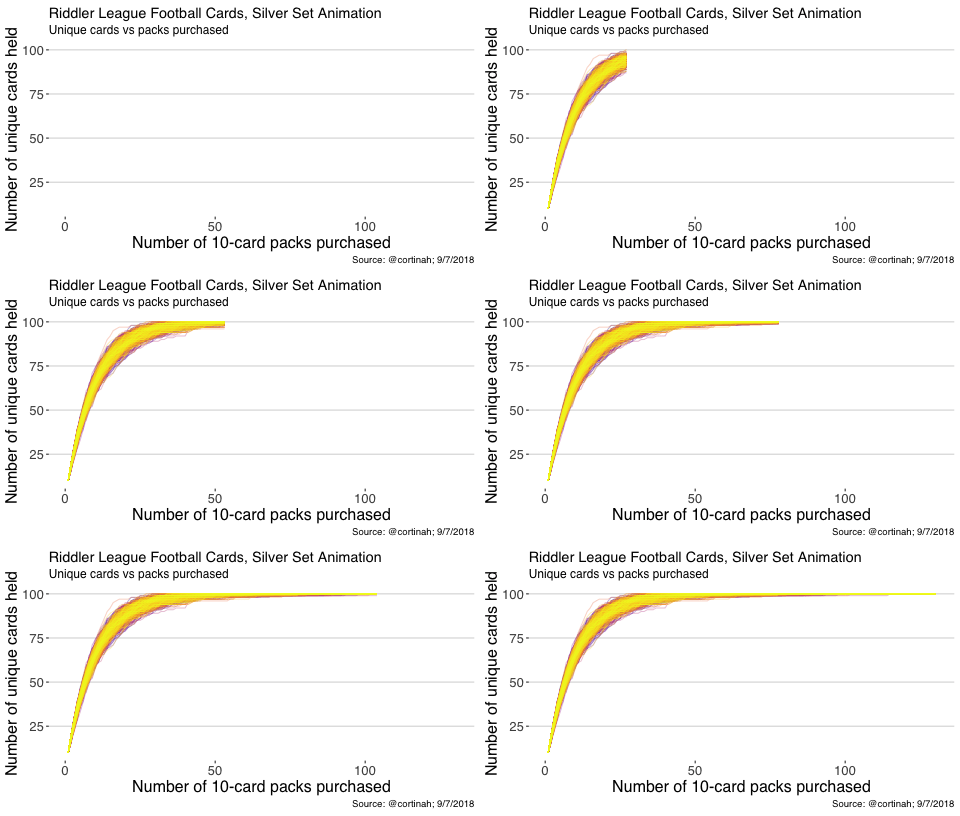
Where \(\sigma(x)\) is the standard deviation of the number of 10-card packs needed across all simulations and n is the number of simulations. For the Silver Set I went with 2,500 simulations which results in a S.E. of 0.24. Accordingly, a 95% confidence interval for the number of 10-card packs needed of (49.18, 50.15). At the end of this post I take a stab at an animation of the paths to a complete Silver set.
Silver set simulation (100 unique cards)
library(tidyverse)
library(ggthemes)

cards <- 1:100
runs <- 2500
total <- vector("numeric",runs)
all_runs <- as.data.frame(matrix(NA,nrow=130,ncol=runs))
run <- 1
set.seed(1234)

while(run<=runs) {

  have <- vector("numeric",10)
  count <- 0

  repeat {
    draw <- sample(cards,10,replace=F)
    count <- count+1
    have <- unique(c(have,draw))
    all_runs[count, run] <- length(have)-1
  if (all(cards %in% have)) break
        }

  total[run] <- count
  run <- run+1
  }

ggplot(as.data.frame(total),aes(x=total)) +geom_density(fill='lightgrey') +
  theme_hc() +labs(x='Number of 10-card packs needed',
                   title='FiveThirtyEight Riddler Classic: Riddler League Football Cards, Silver Set',
                   caption='Source: @cortinah; 9/7/2018',y='Probability Density',
                   subtitle='Mean number of packs needed: 49.7; number of weeks needed: 4.97 (5)\nStandard error of estimate: 0.24') +theme(axis.title = element_text(size=16))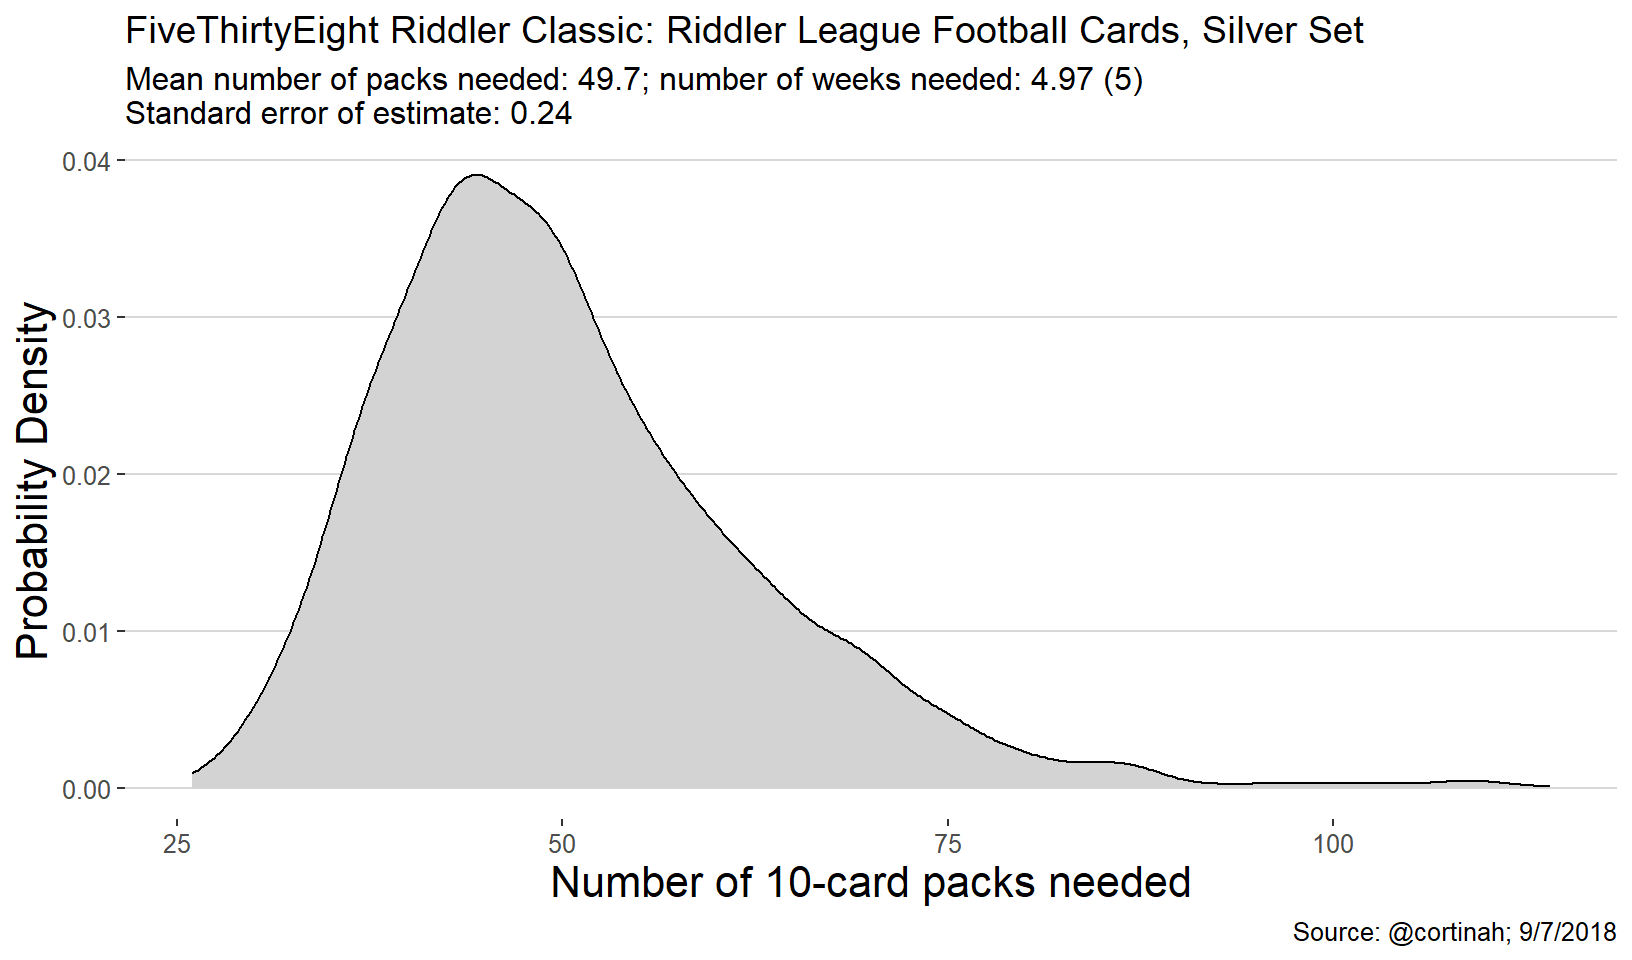
all_runs[is.na(all_runs)] <- 100

mean_runs <- data.frame(run=1:130,mean=rowMeans(all_runs))

all_runs <- gather(all_runs)
all_runs <- all_runs %>% group_by(key) %>% mutate(run=1:n())

ggplot(all_runs,aes(x=run,y=value)) +geom_line(aes(color=key)) +theme_hc() +
  theme(legend.position="none") +scale_color_viridis_d(alpha=0.3,option = 'C') +geom_line(data=mean_runs,aes(x=run,y=mean),color='red',size=1.2) +
  labs(x='Number of 10-card packs purchased', title='FiveThirtyEight Riddler Classic: Riddler League Football Cards, Silver Set',
       caption='Source: @cortinah; 9/7/2018',y='Number of unique cards held', subtitle='Unique cards vs packs purchased path visualization') +
  theme(axis.title = element_text(size=16))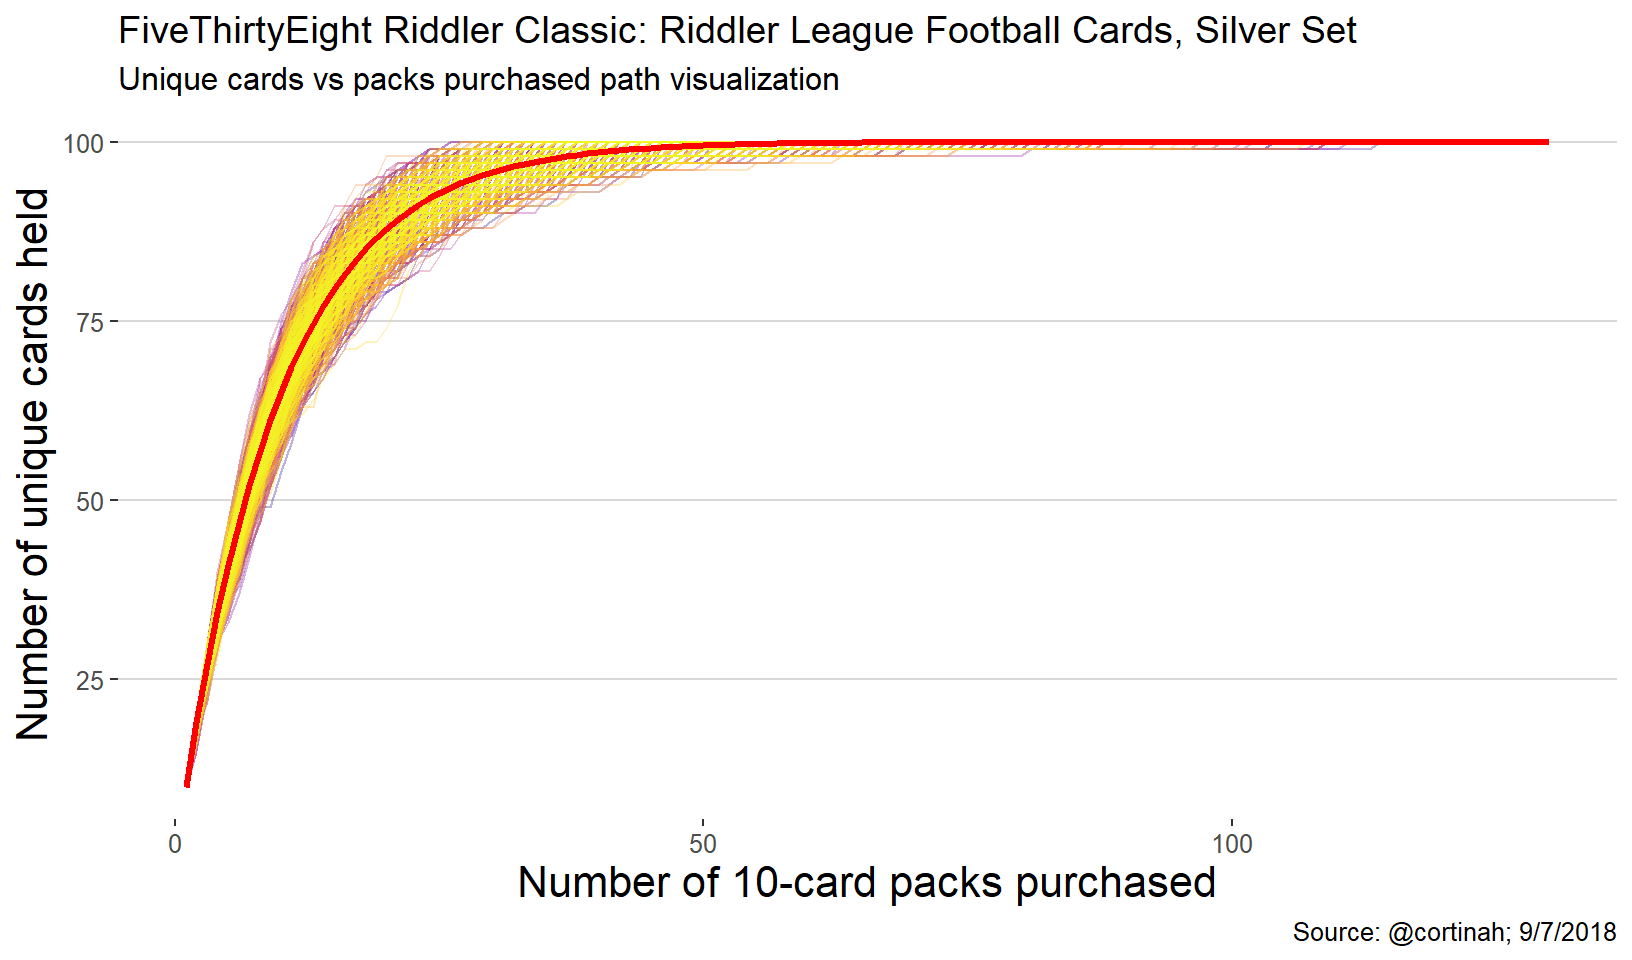
Gold set simulation (300 cards)
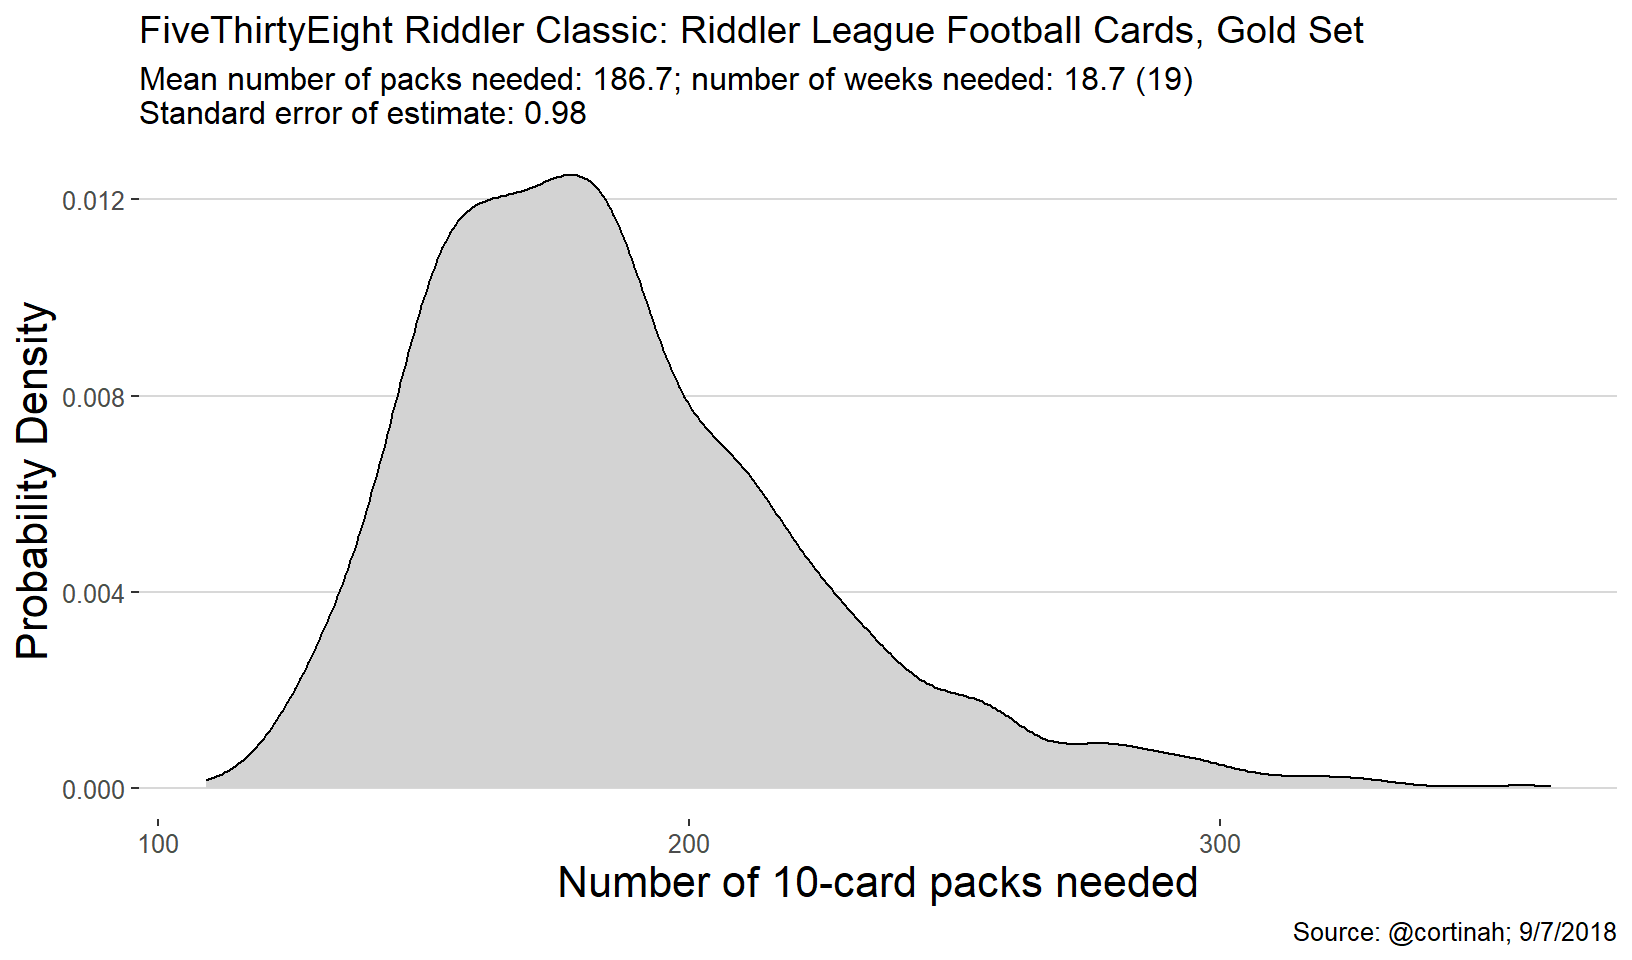
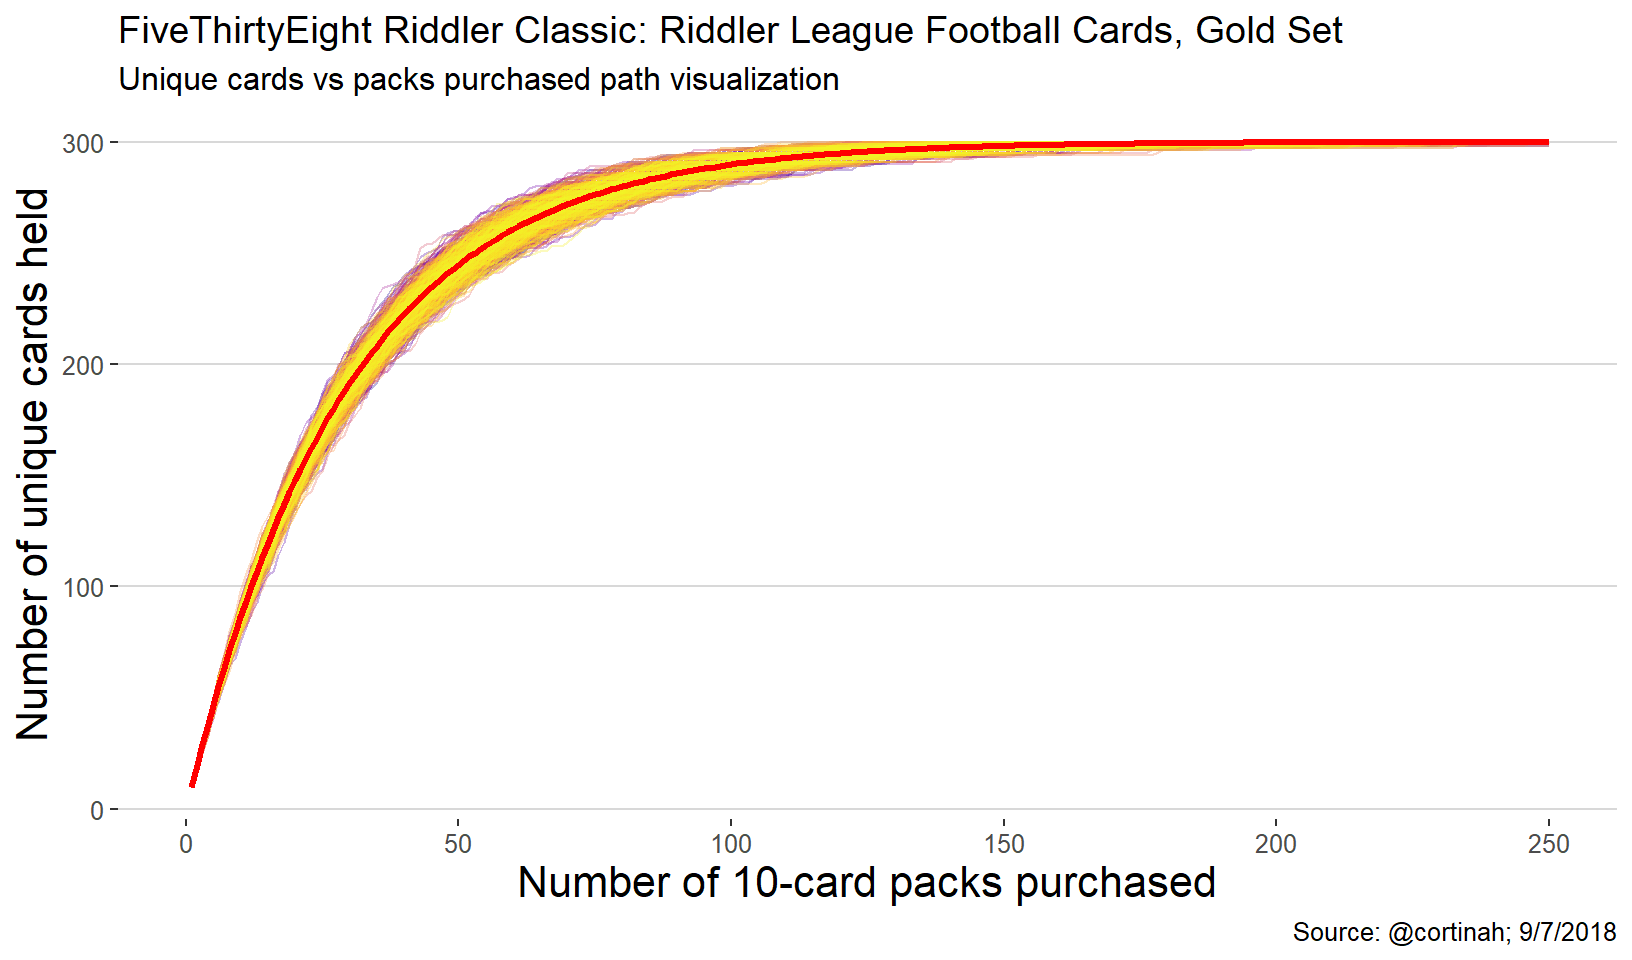
The Gold set requires 300 unique cards and therefore on average about 187 10-card packs. Since it’s more computationally intensive –and I’m not very patient– I reduce the number of simulations to 1,500 which results in a standard error of the mean of about one.
Let’s end with an animation of the Silver Set simulation
Everyone seems to love animated gifs nowadays. Thank you @thomasp85 for gganimate package.
As always, thank you Oliver Roeder (@ollie) for the fun riddlers.